
Overview
Observe step by step how your agent reasons, which tools it uses, and how it constructs its final response.
Before you begin
- Your agent has been executed at least once. See Test and evaluate.
- Recommended: have a session in progress or recently completed to explore the visualizer with real data.
Steps
1. Access the visualizer
From the Monitoring Hub, click on a session card to open the visualizer with that session pre-loaded.
You can also access the visualizer directly via the URL /agent-visualizer. To load a specific session, add the ?sessionId=xxx parameter to the URL.
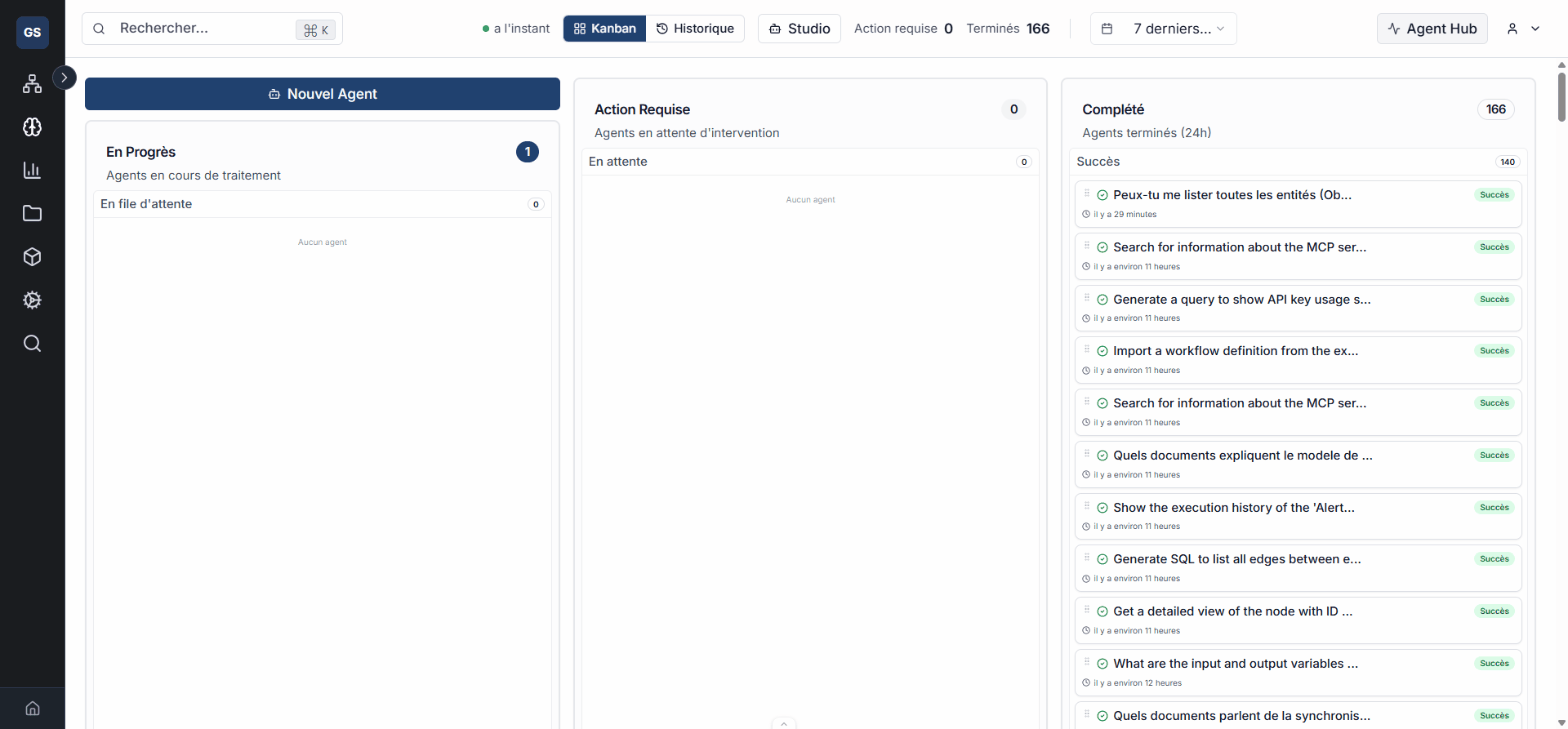
2. Understand the canvas
The visualizer displays a canvas on a dark background representing the agent's reasoning path.
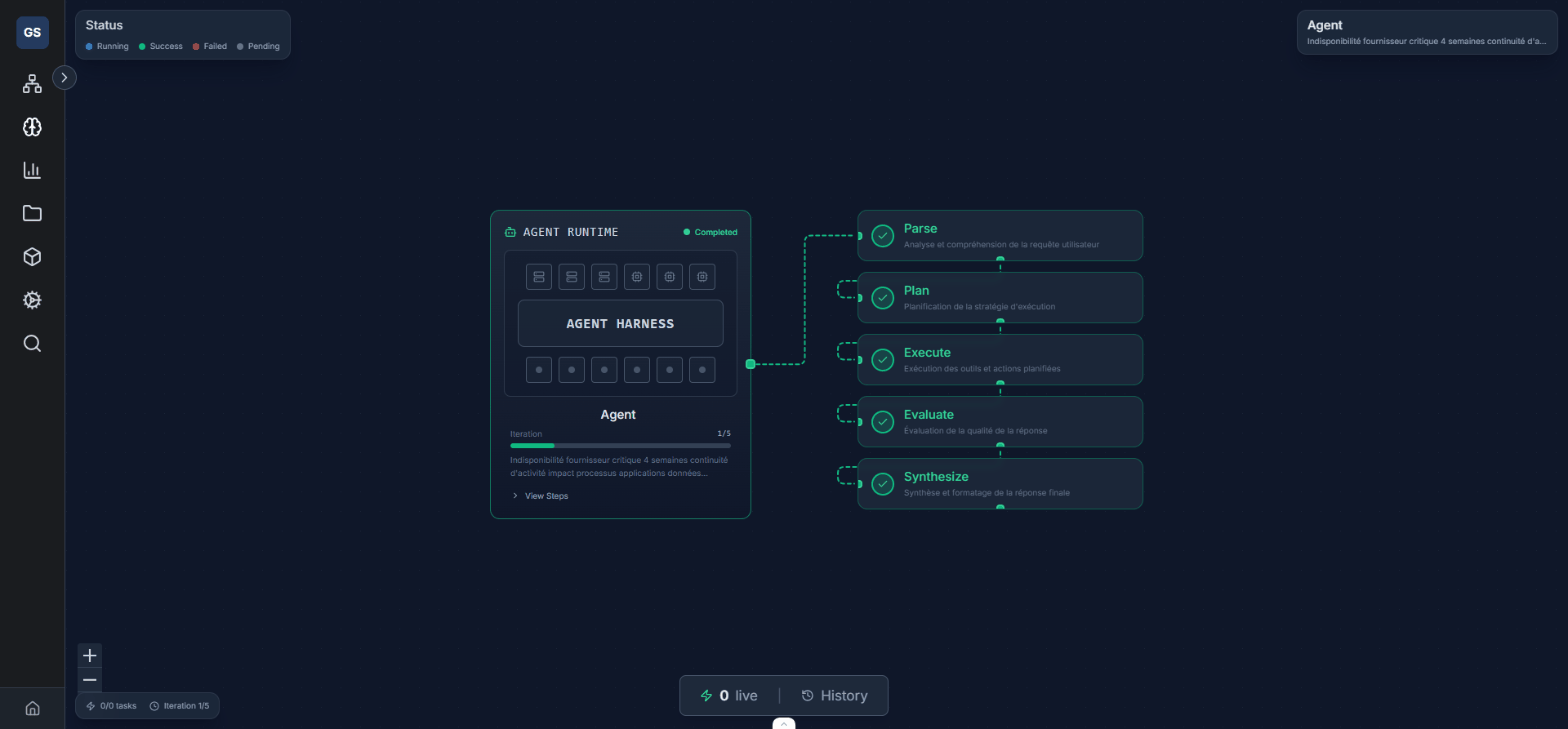
On the left: the main agent node displays the agent name, session identifier, execution status, iteration counter, connected tools, and the model used.
On the right: reasoning steps are arranged vertically in execution order:
| Step | Role |
|---|---|
| parse | Analyzes the user's question |
| plan | Determines the resolution strategy |
| execute | Launches the necessary tools |
| evaluate | Verifies the obtained results |
| synthesize | Formulates the final response |
| trace | Records the complete execution trace |
Each step displays a status indicator:
- Green: step completed successfully
- Blue (halo): step currently processing
- Grey: step pending
Below the steps: individual execution nodes detail each tool call with its name, status, and duration.
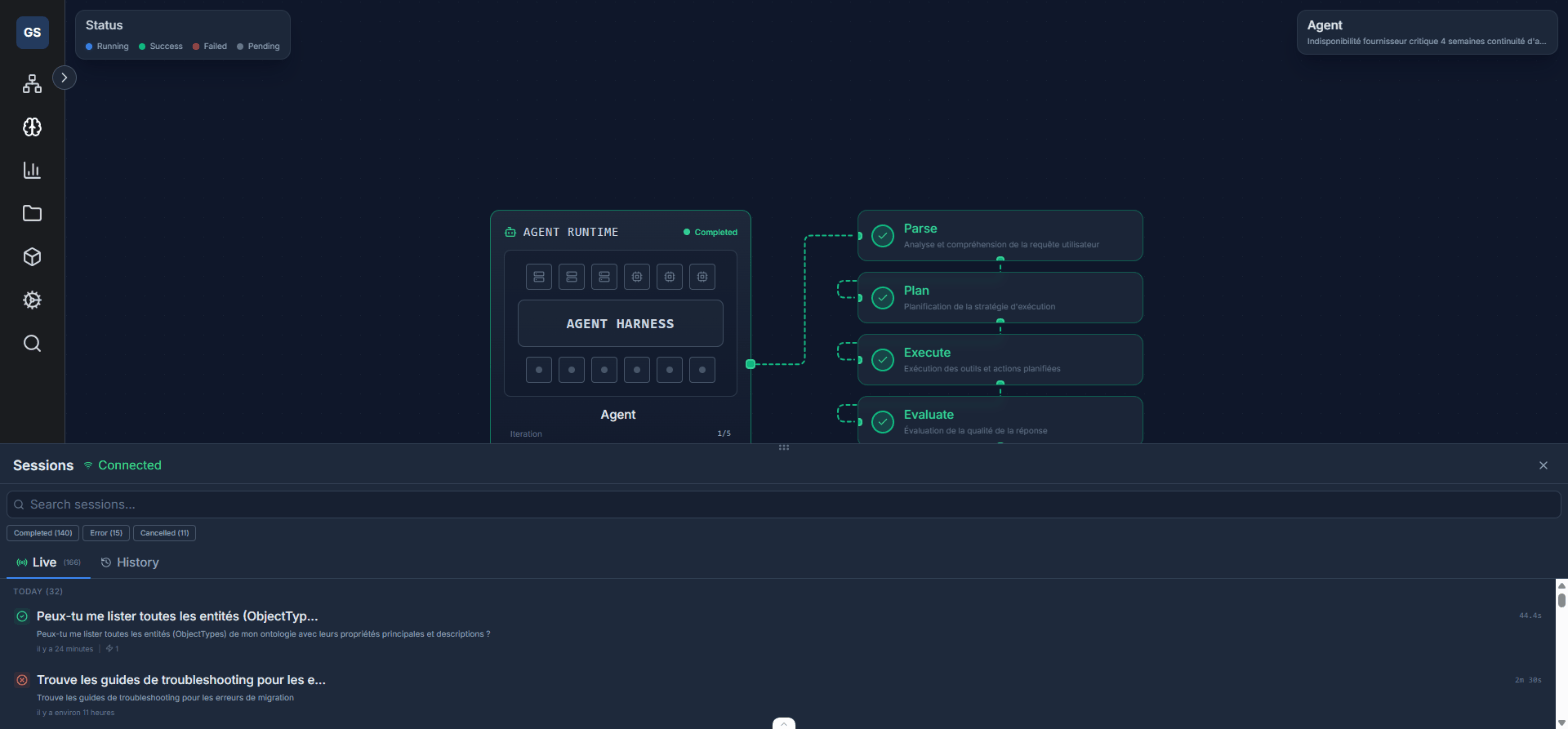
3. Select a session
The Session History panel (at the bottom of the canvas) lists recent sessions with their timestamp, status, and agent name.
Click on a session to load its reasoning path into the canvas.
4. Follow an execution in real time
When a session is in progress, the canvas updates as the agent progresses through its steps.
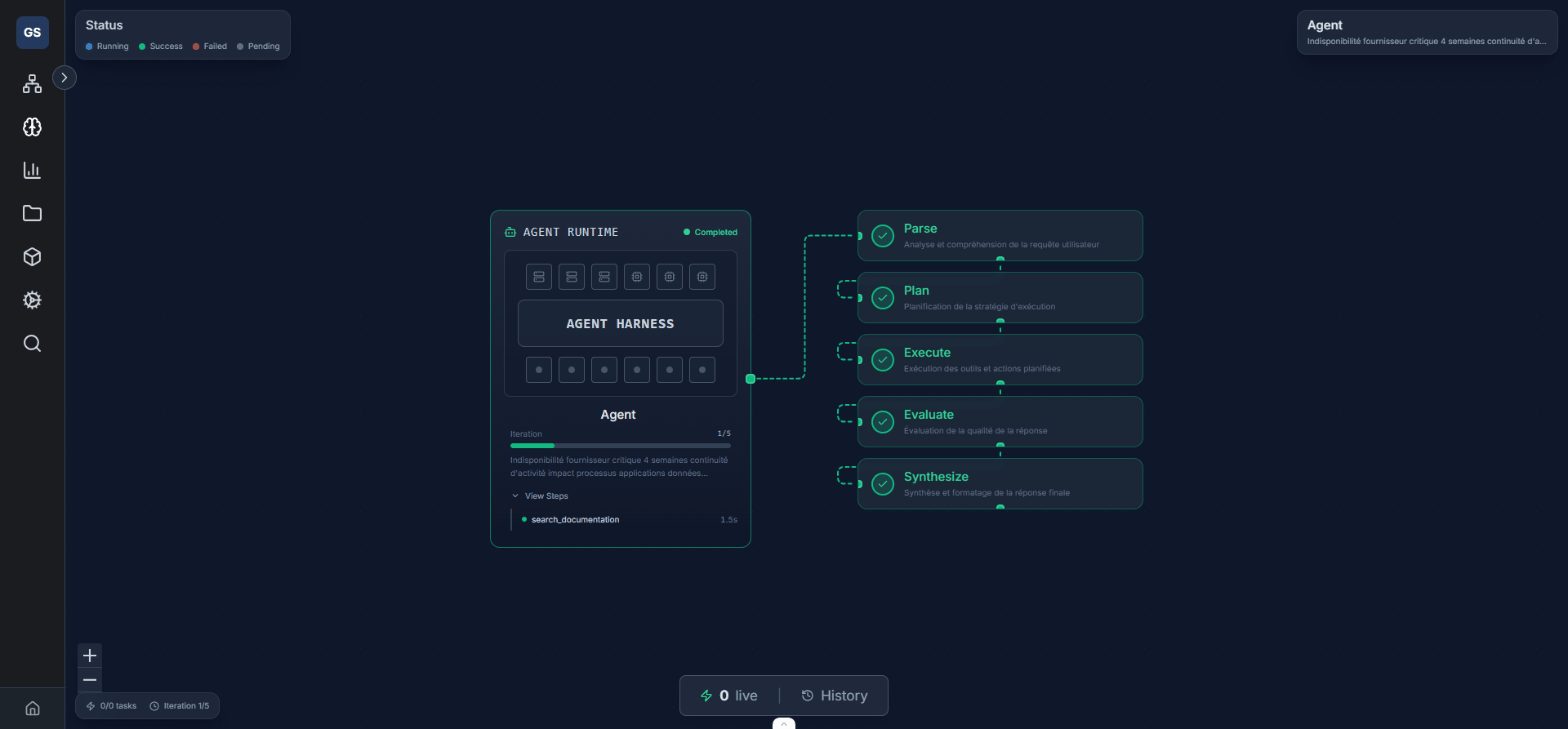
Use the Auto-follow button to automatically center the canvas on the active node. This mode is useful to keep track of the current step during a long execution.
5. View statistics
The statistics panel (bottom left) displays:
- Progress bar: overall execution progress
- Task statistics: number of tasks planned, in progress, and completed
- Token consumption: number of tokens used for the session
The legend panel (top left) explains the meaning of colors and statuses displayed on the canvas.
Expected result
Limitations and common errors
- The canvas uses a dark theme. If readability is insufficient, adjust your screen brightness.
- For sessions with a large number of tasks, use the minimap and zoom controls to navigate efficiently.
- If no session is displayed, verify that your agent has been executed at least once from Test and evaluate.
Next steps
- Configure tools: adjust your agent's tools based on observations from the visualizer.
- Test and evaluate: rerun tests after your adjustments.
Need help?
Contact us: Support and contact.