
At a glance
Monitor the health of your syncs in real time from the Monitoring Hub. Quickly identify failures and review the full sync history.
Before you start
- At least one source configured and active (see Data Sources)
Access the Monitoring Hub
From the Live Data page, click the Monitoring button in the header. The direct URL is /livedata-hub.
Key indicators (KPI)
The top of the page displays 5 indicators:
| Indicator | Description |
|---|---|
| Connected sources | Total number of active sources |
| Freshness | Average time since the last successful sync |
| Overall health | Percentage of sources with no errors |
| Failures 24h | Number of failed syncs in the last 24 hours |
| Syncs in progress | Number of syncs currently running |

Sync Kanban
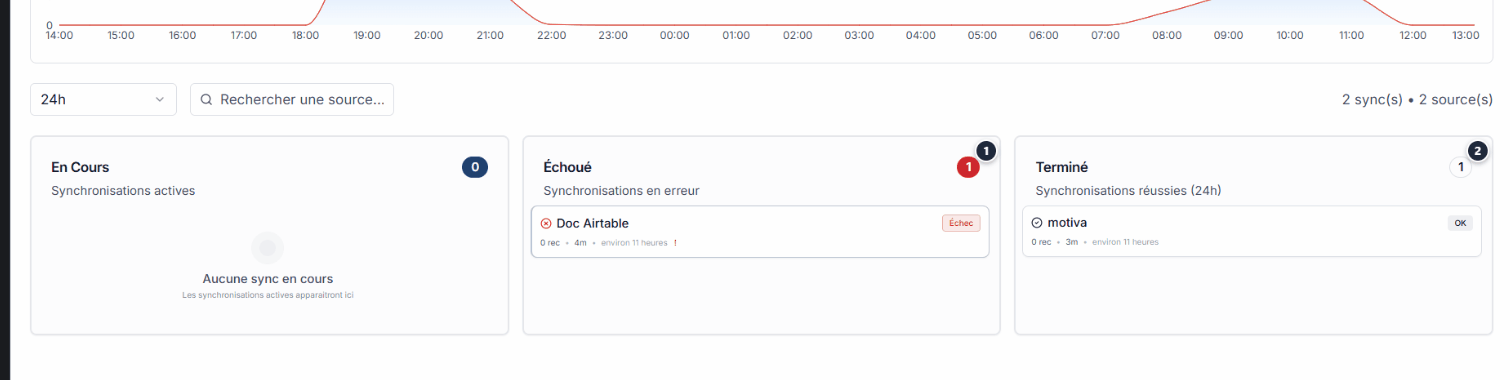
Below the KPIs, a Kanban board organizes syncs into 3 columns:
| Column | Content |
|---|---|
| In progress | Syncs currently running |
| Failed | Syncs in error (click to view details) |
| Completed | Successfully completed syncs |
Filter syncs
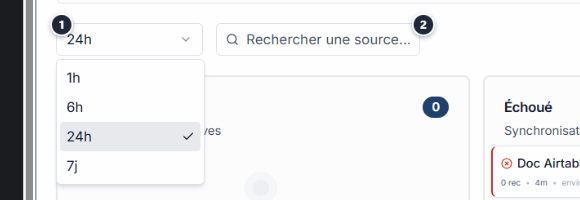
Use the filters to refine the view:
| Filter | Options |
|---|---|
| Period | 1h, 6h, 24h, 7 days |
| Search | By source or connector name |
Expected outcome
See also
- Data Sources -- Configure and manage your data sources.
- Troubleshooting -- Identify and fix connection errors.
- Connector catalogue -- Browse available connectors.
Need help?
Write to us: Support and contact.